Appearance
Structure
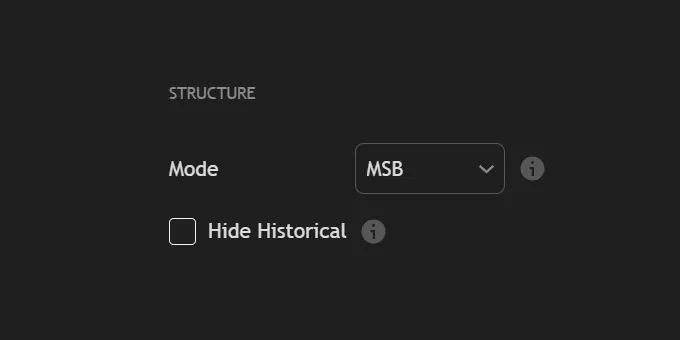
Structure detection is the foundation of everything REx draws. This section controls which structural method REx uses — MSB or BOS — and how much historical data is shown on the chart.
What is Market Structure?
Price doesn't move in straight lines. It sweeps highs, takes out lows, and creates ranges between those swings. Market structure is the map of those ranges.
- A swing high is a peak flanked by lower highs on both sides.
- A swing low is a trough flanked by higher lows on both sides.
- A range is the area between a confirmed swing high and swing low after a break.
When price breaks a swing, it marks a shift in momentum. That break — and the range it creates — is where REx draws your Order Blocks, Breaker Blocks, and key levels.
| 1. | Mode defines how market structure is detected and displayed. Both engines run simultaneously — this setting controls which one is shown on the chart. |
| → MSB — "Catch the turn early." | |
| → BOS — "Follow the trend, skip the noise." | |
| The selected mode also determines where Order Blocks are placed — each mode uses a different structural reference point to define the zone boundary. |
| 2. | Hide Historical removes past structure data from the chart, keeping only the most recent and relevant information visible for a cleaner view. |