Appearance
HTF Structure
Structure Style controls how REx draws break lines, range boundaries, and the equilibrium midpoint. Purely visual — none of these settings affect detection logic.
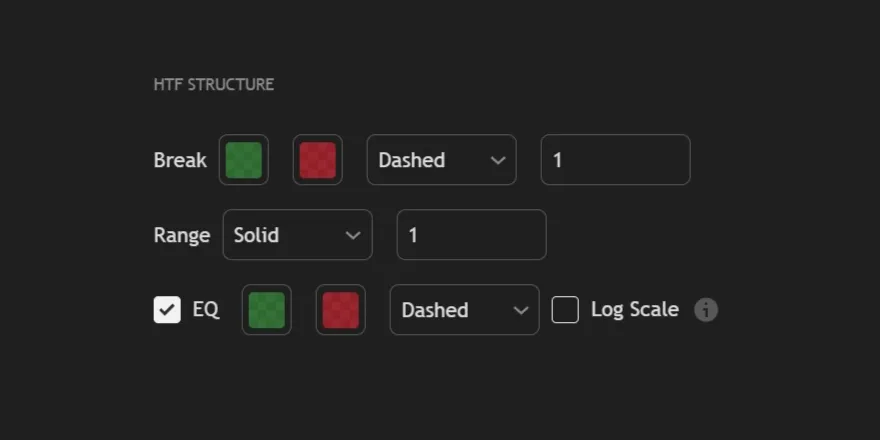
| 1. | Break controls how break points are displayed on the chart, including their color, line style, and thickness. |
| 2. | Range defines the visual style of the active range, allowing you to adjust the color, line style, and thickness |
| 3. | EQ (Equilibrium) displays the midpoint of the range. When enabled, you can customize its color and line style. The Log Scale option adjusts the equilibrium calculation to match logarithmic charts. |
.webp)